本文通过监控树莓派和 K3S 集群介绍 Grafana 的安装、配置和使用。
概述
grafana 能够查询、可视化、预警和探索您的 metrics、logs 和 traces。将时间序列转化为具有洞察力的图标和可视化的数据。
部署
helm repo add grafana https://grafana.github.io/helm-charts &&
    helm repo update &&
    helm upgrade grafana grafana/grafana -f grafana/values.yaml --install --namespace monitor --create-namespace
浏览器打开:
kubectl port-forward services/grafana 6789:80
Dashboard
导入和导出 dashboard 可以方便的使用他人已经配置好的 dashboard。
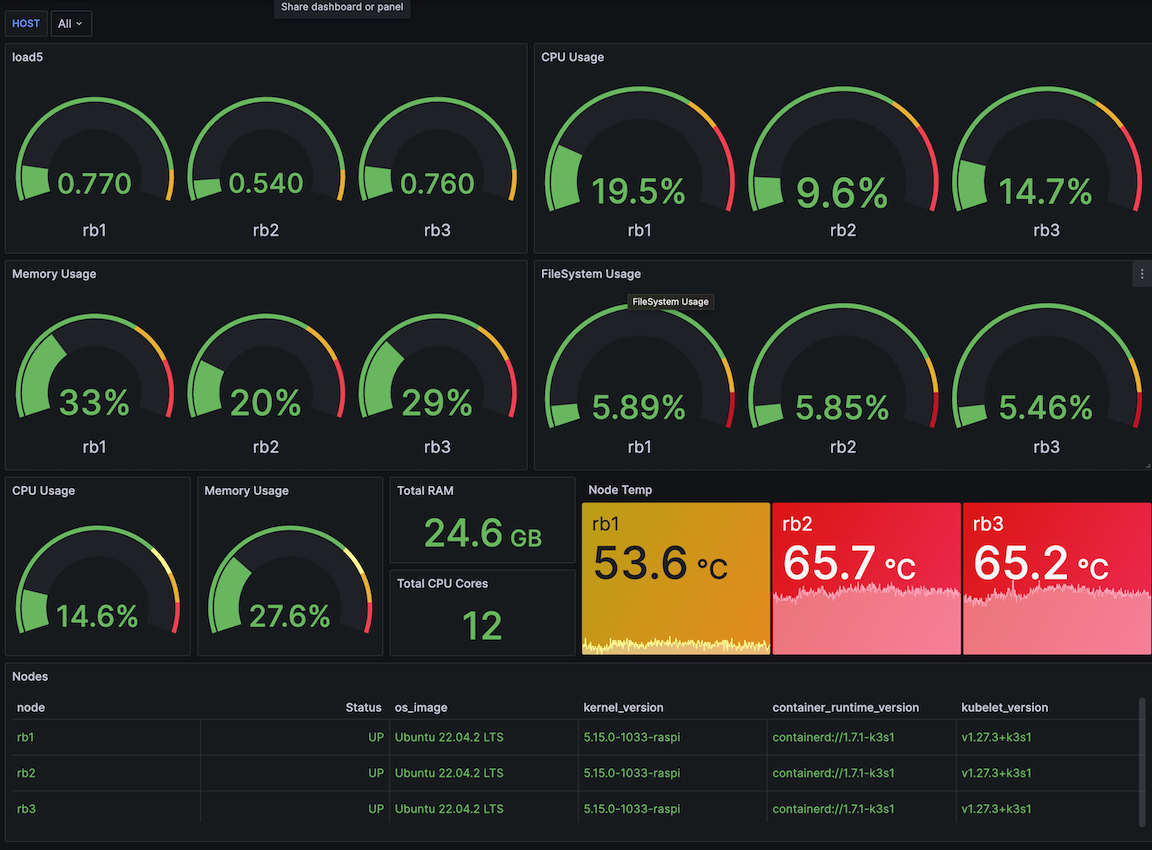
当前树莓派使用的 dashboard: https://grafana.com/grafana/dashboards/19195-raspi-overview/
配置
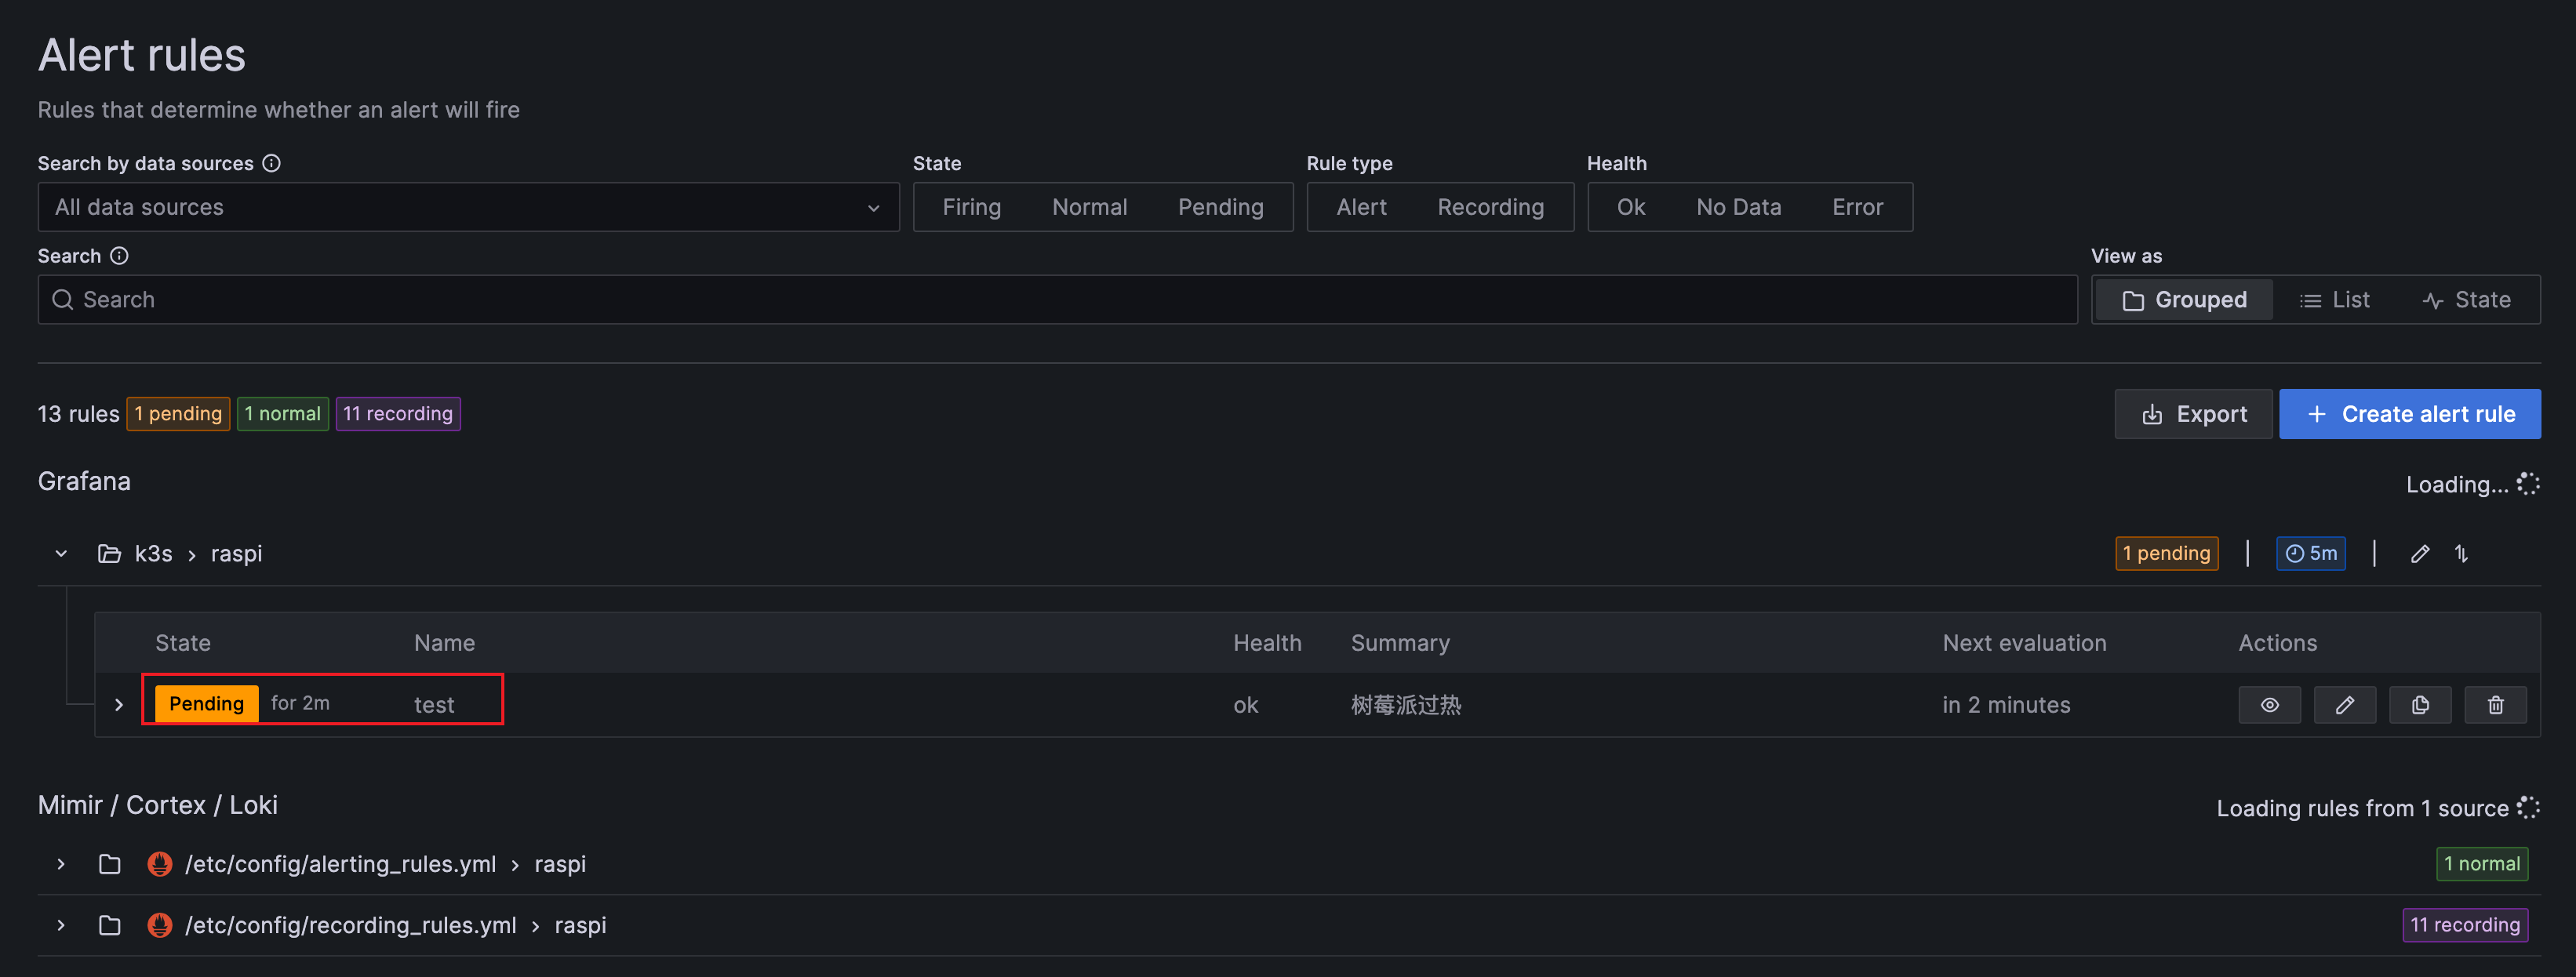
告警
应用
树莓派监控
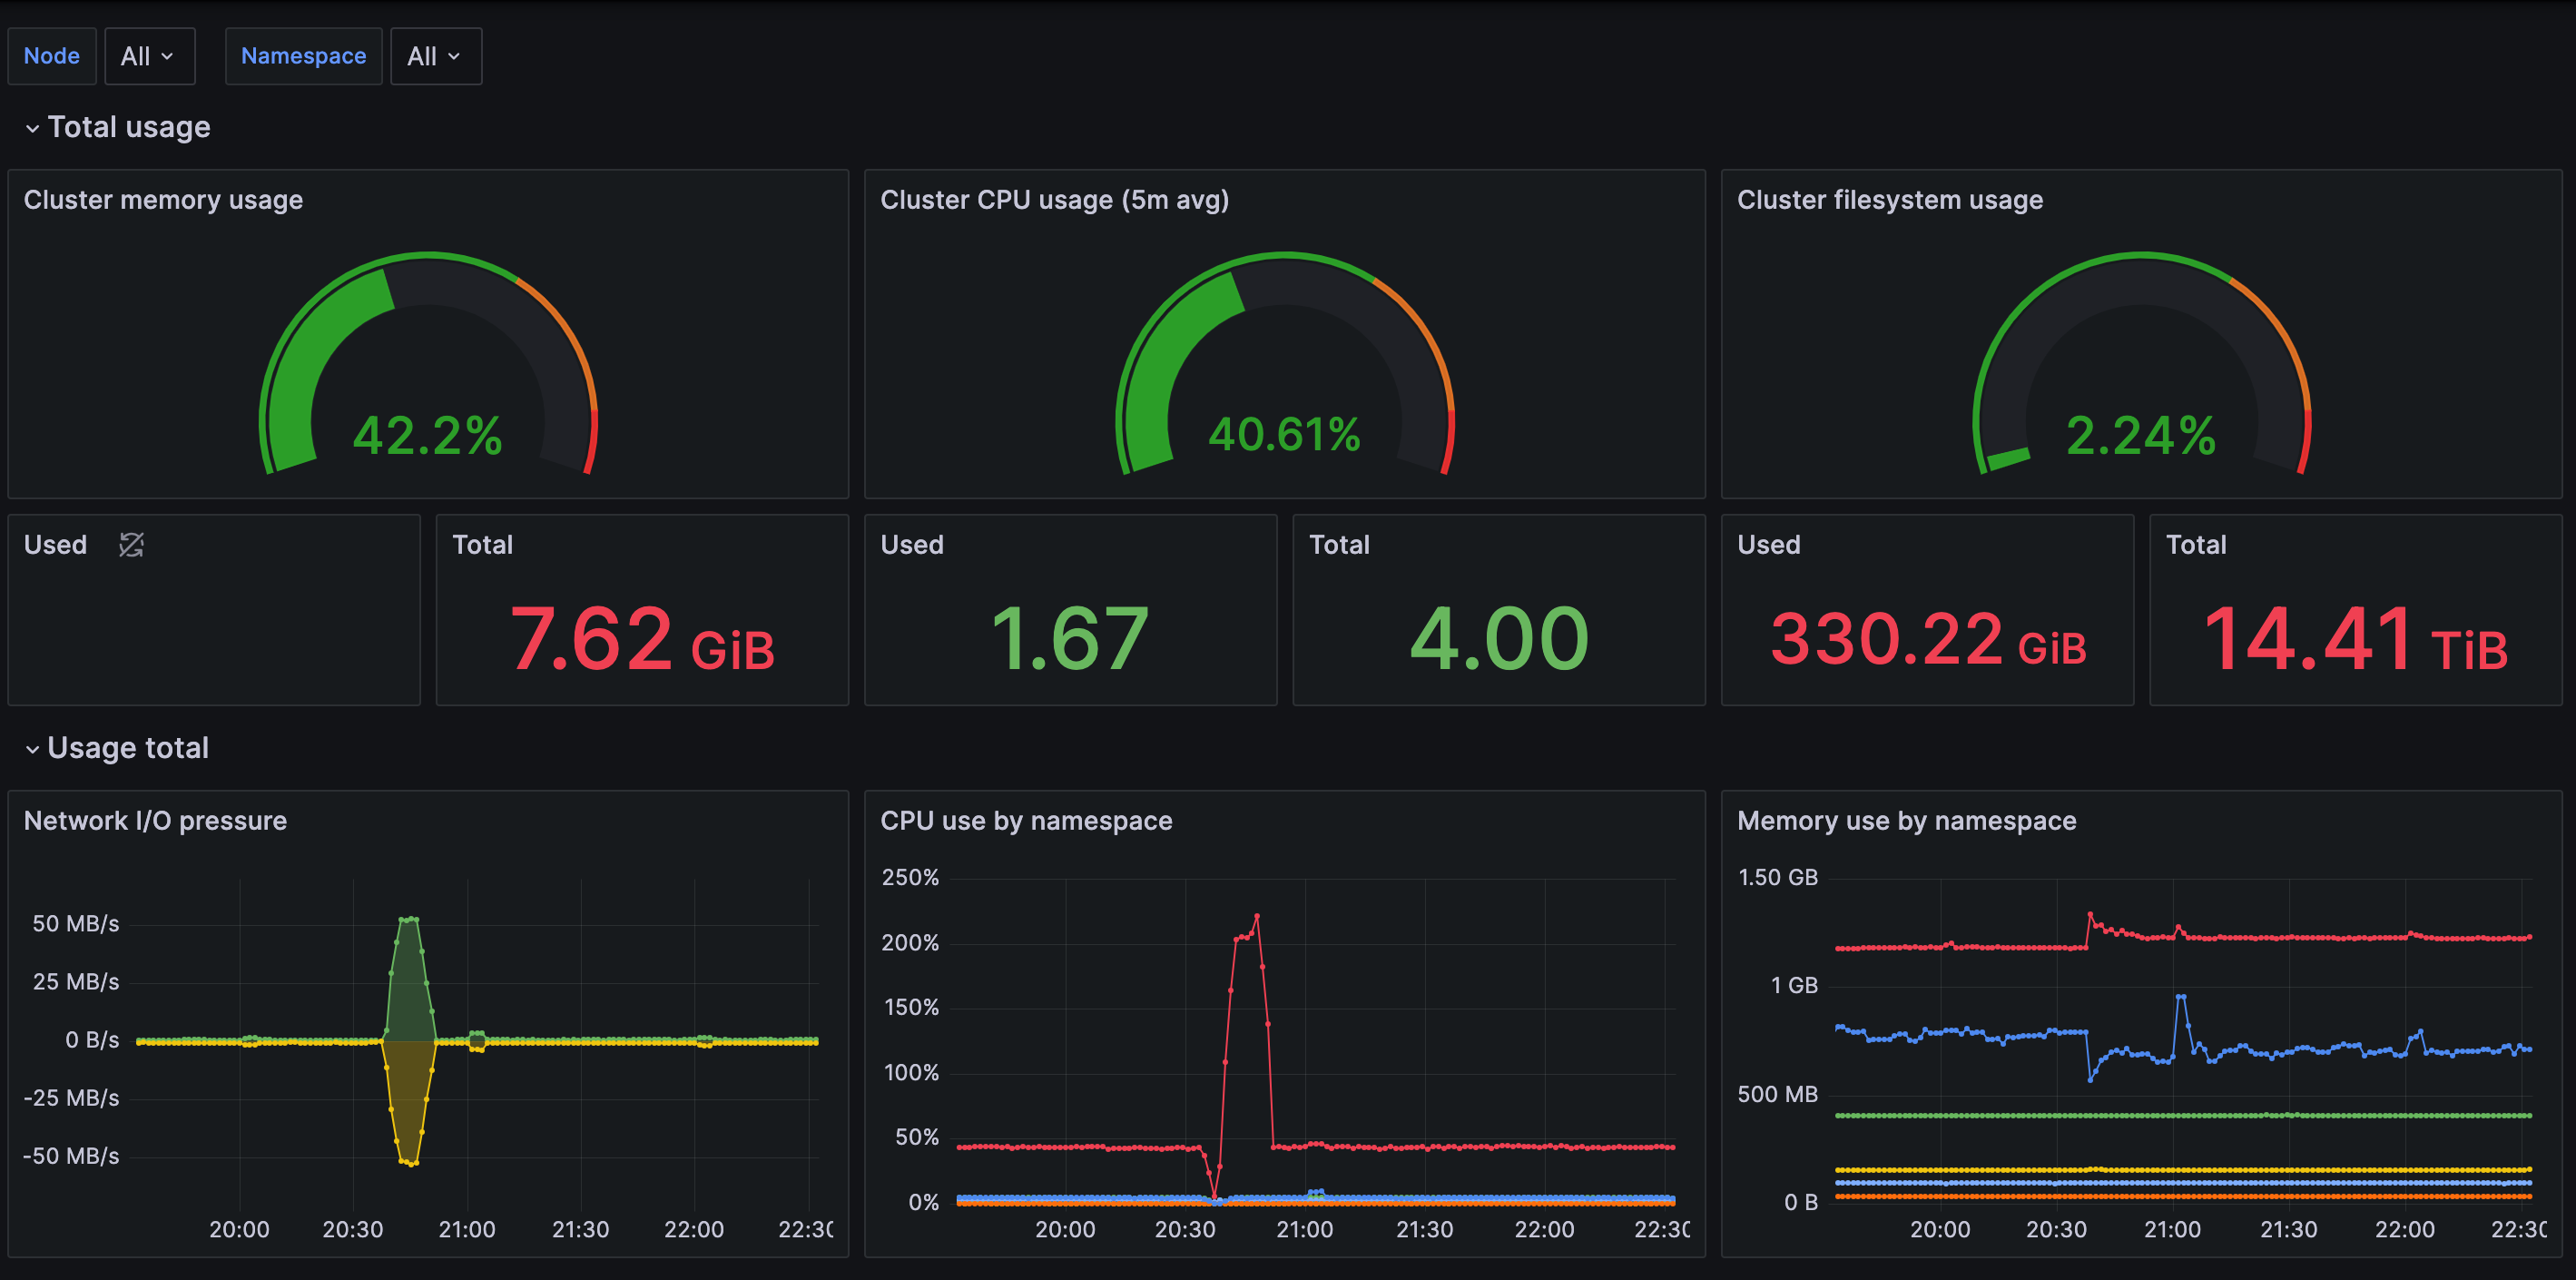
k3s 监控


评论